


Hi, I would like to start a discussion around a prototype that aims at improving consumption of camera trap data.
How is it different (in theory) from existing tools?
I recently teamed up with people at EarthToolsMaker to work on technologies for wildlife and planet. We noticed that while there was a lot of different tools to help manage and label raw pictures, there was less emphasis on what should happen next.
Once the data is correctly cleaned and labeled, what's the best way to consume it? Often, the solution is to create reports to answer specific questions such as: Are there endangered species in this area? What's the population size of X?
Unfortunately, those reports are often static and don't allow to answer follow up questions. They also don't help discovering new insights that require more explorations.
We think there should be a more interactive way to explore, analyse, visualise and search the data. By focusing on this stage of the process, we can narrow down the scope of the tool (doing one thing well) while opening opportunities for different inputs. For example, audio recordings and simple observations can also benefit from such a tool.
Below is a short recording of a prototype showing our current ideas. We intentionally ignore (for now) other concerns such as data format/ingestion/storage to focus on the end goal - the user interface.
I would be happy to answer any questions and would love some feedback on motivation and ideas. If you already use tools with similar goals, don't hesitate to mention them so we can discuss the differences if any.
Thanks, Jeremy
23 January 2025 4:32am
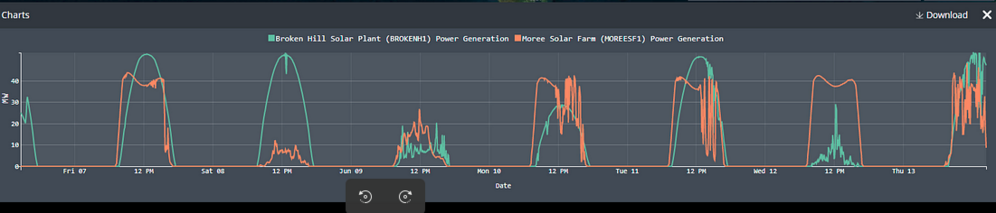
One interesting improvement would be to combine a chart/plot on top of the time slider. When you are interested in multiple species, it would be good to show their abundance over the period of time as you are using the time slider.


23 January 2025 5:52pm
I've always wondered what happens to the millions of images captured globally by camera traps - obviously some end up in data collections available to researchers, but how does the average citizen scientist get access to some for less formal use?
Your prototype looks like a great solution for publishing images for viewing - whether just for pleasure or scientific purposes — which often gets blurred for average citizen scientists without the technical skills to develop their own solutions.
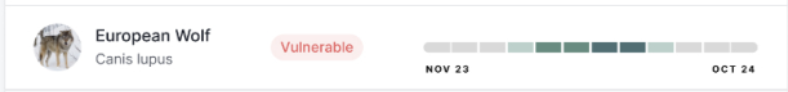
A solution that is easy to install, maintain and keep up to date with images can expose a lot of images to others - uses like visualizing the distribution of animals over time, abundance heatmaps, seasonal migrations and location changes, comparing locations year by year to assess impacts, etc. can all make data more existing for end users.
I would love to know more about your current protype - how can I get access?


26 January 2025 1:55am
Hi Jeremy,
This looks like an interesting tool. Are you planning for this to be a standalone tool? It might be good to integrate it with camera trap management software like Trapper.
Regards,
Ed

29 January 2025 11:31pm
Hi
Does the database recognize Australian Animals?
Doug
Arky