Análise de Cluster no Kaleidoscope Pro: de Classificadores Simples a Avançados (Intermediário)
24 April 2025 7:03pm
Extração de Sinais Usando o Kaleidoscope Lite (Intermediário)
24 April 2025 7:01pm
Introducción al uso de Kaleidoscope Pro para Murciélagos (Principiante)
24 April 2025 6:54pm
Transformando el Sonido en Descubrimiento (Principiante)
24 April 2025 6:50pm
Reunión de la Comunidad Latinoamericana: Aplicaciones de Drones en el Monitoreo de Fauna
 Vanesa Reyes
and 1 more
24 April 2025 4:08pm
SpeciesNet: first impressions from 37k images in Namibia
23 April 2025 11:28pm
New Insect Camera Trap is Now Available!
23 April 2025 7:26pm
RFP: AI + freshwater biodiversity
23 April 2025 5:47pm
What software to use?
6 March 2025 4:39pm
22 April 2025 7:39am
Actually, detection of ~2000 "global" species is now supported in AddaxAI via supoort of SpeciesNet.
23 April 2025 3:28am
That's great!
Project Update — Nestling Growth App
22 April 2025 10:45pm
Geospatial Group Café April 22
21 April 2025 6:47pm
Beyond the Tech Hype / Más Allá del Hype Tecnológico
21 April 2025 3:59pm
Drone & ai use for uncovering illegal logging camps
21 April 2025 4:49am
21 April 2025 12:49pm
Hi Adam!
Sounds like you have your work cut out for you. I have not used radar systems or AI systems for this sort of detection, but there are methods using change detection models to visualise changes in forests where logging may be occuring between different dates using drone photogrammetry and GIS software. I have found these methods very effective when monitoring deforestation, especially because not only can you quickly visualise where deforestation has happened, but you can also quantify the damage at the same time. Let me know if you would like to learn more.
Kind regards
Sean Hill
WILDLABS AWARDS 2024 - Enhancing Pollinator Conservation through Deep NeuralNetwork Development
7 April 2024 5:55pm
18 April 2025 10:33pm
Hi Kim,
That's really interesting! I didn't realize thermal worked with bees! Thanks so much for sharing that detail.
Liz
19 April 2025 12:40pm
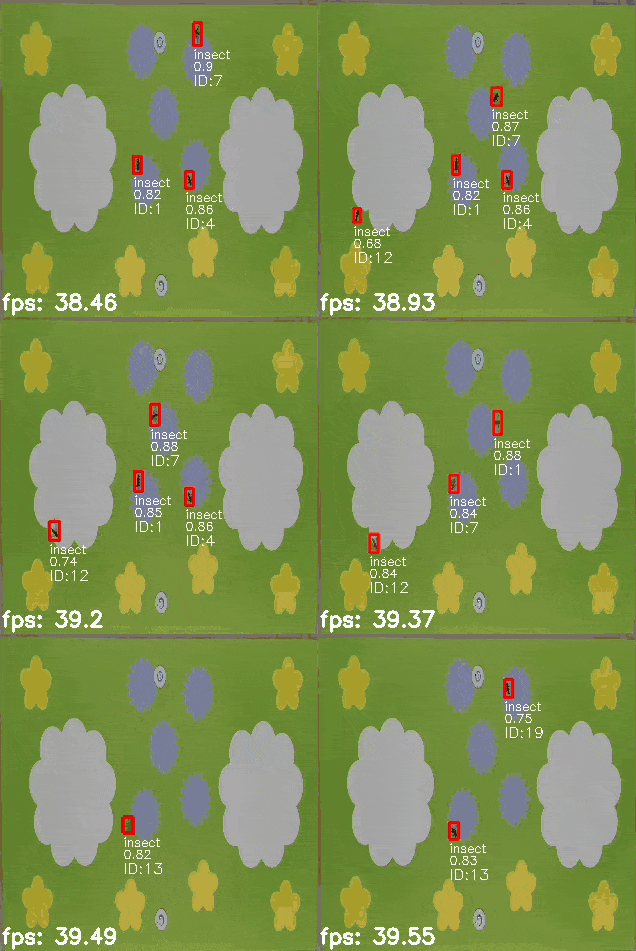
Great work! Do you think the night time models also worked better due to lack of interference from shadows being counted? or maybe issues around a non-standard background.
If it helps, I believe the creators of InsectDetect which is open source, did a lot of work training their model to differentiate insect shadows vs. insects. Also after testing their smart trap on flowers, went with a standardised, non-lethal attractive background.
InsectDetect: Build your own insect-detecting camera trap!
20 April 2025 5:14pm
Hey Amber, that makes a lot of sense! And this effort by Insect Detect is amazing, thanks for sharing!
MyProgress: Advancing GIS and R programming skills.
20 April 2025 1:45pm
Introducción al uso de Kaleidoscope Pro para Murciélagos (Principiante)
18 April 2025 3:50pm
Global Science Data Management and AI Graduate Intern
18 April 2025 2:52pm
Enterprise Geospatial Undergraduate Intern
18 April 2025 2:50pm
FROM VULNERABILITY TO SECURITY: INSPIRING COEXISTENCE THROUGH A RESILIENT BOMA
17 April 2025 8:41pm
WILDLABS-WWF Graduate Intern
 WILDLABS Team
and 1 more
17 April 2025 6:06pm
Catch up with The Variety Hour: April 2025
16 April 2025 5:00pm
¡Bienvenidos a la comunidad Latinoamericana! // Welcome to the Latin American community!
30 September 2024 5:05pm
6 October 2024 4:11pm
Bem-vindo Rafael!!
16 April 2025 4:40pm
Hola. Me gusto la idea! prefiero en español, mas que nada en todo este tema de informatica, etc, que ya posee un alto grado de dificultad. Aca en Argentina estoy trabajando con anfibios y grabadoras digitales automaticas, ahora comenzando a explorar sobre detección automatica o semiautomatica.
16 April 2025 4:52pm
Bienvenido Maxi!
Ground Truth: How Are You Verifying What Maps Show?
 Léa Smadja
and 1 more
16 April 2025 3:35pm
Overview of terrestrial audio recorders with associated metadata info
15 April 2025 2:53pm
Geospatial Group Café (April)
 Elsa Carla De Grandi
and 2 more
15 April 2025 11:38am
21 April 2025 4:59pm
23 April 2025 9:17am
11 June 2025 11:05am
WILDLABS Climate Week Conservation Tech Meetup: Washington, DC
 Alex Rood
and 2 more
14 April 2025 6:47pm
Conservation Applications for Google Solar API
12 April 2025 11:35am
14 April 2025 12:54pm
Do you know if there are plans to expand this beyond the global North? Many folks in this community are living and/or working outside of the areas where this dataset is limited to and thus would not be able to make use of it.
14 April 2025 6:27pm
Yes, I know about this big limitation,
As far as I know they are working to increase the coverage available for this solution.
For trusted developers, there are more regions available.
More information about the coverage can be found here:
DeepFaune v.1.3 is out!
14 April 2025 3:50pm
Papers about gender and disability in conservation tech
21 March 2025 4:56pm
11 April 2025 10:26pm
Wow, thanks for sharing @Nycticebus_scientia. Would love to read further papers on these topics if folks have them!
scikit-maad community
8 August 2024 10:16am
19 February 2025 10:26am
Hello!
I could be wrong, but from looking at the source code of the ACI calculation on the scikit-maad it appears that it autosets j = length of signal. If you want to break it down to e.g. 5 windows you can break the spectrogram into 5 chunks along time and then sum the ACI in each window. This gives a more similar result to the results you got using the other methods. What did you set as nbwindows for seewave?
s, fs = maad.sound.load('test_data_ACI/LINE_2003-10-30_20_00_34.wav')
Sxx, tn, fn, ext = maad.sound.spectrogram (s, fs, mode='amplitude')
full_time = Sxx.shape[1] # number of time samples in spectrogram
j_count = 5 # number of chunks we want to break it into
window_size = np.floor(full_time/j_count) # total time divided by number of chunks = number of time samples per chunk
ACI_tot = 0
for i in range(j_count):
_, _ , ACI = maad.features.acoustic_complexity_index(Sxx[:,int(i*window_size):int(i*window_size+window_size)])
ACI_tot = ACI_tot + int(ACI)
This gives ACI_tot = 1516
6 March 2025 11:07am
Hi all,
I have recently been utilising the ROI module of scikit-maad to locate non-biophonic sounds across low-sample rate Arctic hydrophone datasets and have a query about how ROI centroids are calculated...
Looking at the source code for the function "centroid_features" in .\maad\features\shape.py, I can see that the function calls "center_of_mass" from .\scipy\ndimage\_measurements.py. This to me suggests that the centroid should be placed where energy is focussed, i.e. the middle of the acoustic signature captured by the masking stage of ROI computations.
I'm a bit confused as to why the centroids I have appear to be more or less placed in the centre of the computed ROIs, regardless of the energy distribution within the ROI. The sounds I'm capturing have energy focussed towards lower frequencies of the ROI bands, so I would have expected the centroid to shift downwards as well.
Has anyone modified how ROI centroids are defined in their work? I'd be quite interested to set up centroids to signify where the peak energy level lies in the ROI, but I'm not quite sure how to do this cleanly.
Any advice would be greatly appreciated, thanks!
Kind regards,
Jonathan
11 April 2025 10:08pm
We are pleased to announce the latest release with several important enhancement, fixes and documentation improvements to ensure compatibility with the latest versions of SciPy and scikit-image as well as with Xeno-Canto.
In this new version, 2 new alpha indices are implemented, aROI and nROI, the latter being a good proxy of the average species richness per 1 min soundscape.
Releases · scikit-maad/scikit-maad · GitHub
Open-source and modular toolbox for quantitative soundscape analysis in Python - Releases · scikit-maad/scikit-maad






19 April 2025 1:08pm
Apologies as I haven't tried this option: AddaxAI (Previously known as EcoAssist). It can work offline, however currently only works for species for which a specific project has already been developed.
AddaxAI: Simplifying camera trap image analysis with AI